
Prometheus+Grafana监控部署

Prometheus+Grafana监控部署
FaPrometheus+Grafana
一、部署Prometheus服务器
环境
| Prometheus(ip:192.168.200.147) | Web1(ip:192.168.200.148) |
|---|
配置时间
1 | # 查看时区 |
安装Prometheus
从官网下载相应版本,安装到服务器上官网提供的是二进制版,解压就能用,不需要编译
下载地址: https://prometheus.io/download/
解压就能用,不需要编译:
1 | #解压到指定目录 |
- 配置文件
- 配置文件中包含三个配置块:
global、rule_files和scrape_configs。 - global块控制 Prometheus 服务器的全局配置。我们有两个选择。第一个,scrape_interval控制 Prometheus 抓取目标的频率。您可以为单个目标覆盖它。在这种情况下,全局设置是每 15 秒抓取一次。该evaluation_interval选项控制 Prometheus 评估规则的频率。Prometheus 使用规则来创建新的时间序列并生成警报。
rule_files块指定我们希望 Prometheus 服务器加载的任何规则的位置。现在我们还没有规则。- 最后一个块,scrape_configs控制 Prometheus 监控的资源。由于 Prometheus 还将有关自身的数据公开为 HTTP 端点,因此它可以抓取和监控自身的健康状况。在默认配置中,有一个名为 的作业prometheus,用于抓取 Prometheus 服务器公开的时间序列数据。该作业包含一个单一的、静态配置的目标,即localhost的9090端口。Prometheus期望度量在/metrics路径上的目标上可用,所以这个默认作业是通过 URL 抓取的:http://localhost:9090/metrics。
- 配置文件中包含三个配置块:
编写服务启动文件并启动服务
1 | vim /usr/lib/systemd/system/prometheus.service |
启动服务
1 | systemctl daemon-reload |
访问http://192.168.200.147:9090/ //若不成功关闭防火墙什么的
二、添加被监控端
1、下载软件包解压并部署
1 | wget https://github.com/prometheus/node_exporter/releases/download/v1.8.2/node_exporter-1.8.2.linux-amd64.tar.gz |
2、创建服务文件,启动服务(Web1)
1 | vim /usr/lib/systemd/system/node_exporter.service |
3、启动服务
1 | systemctl daemon-reload |
4、在Prometheus服务器上添加监控节点(Prometheus)
1 | vim /usr/local/prometheus/prometheus.yml |
用这条命令检查配置文件是否有错误
1 | /usr/local/prometheus/promtool check config /usr/local/prometheus/prometheus.yml |
5、重启Prometheus服务
1 | systemctl restart prometheus.service |
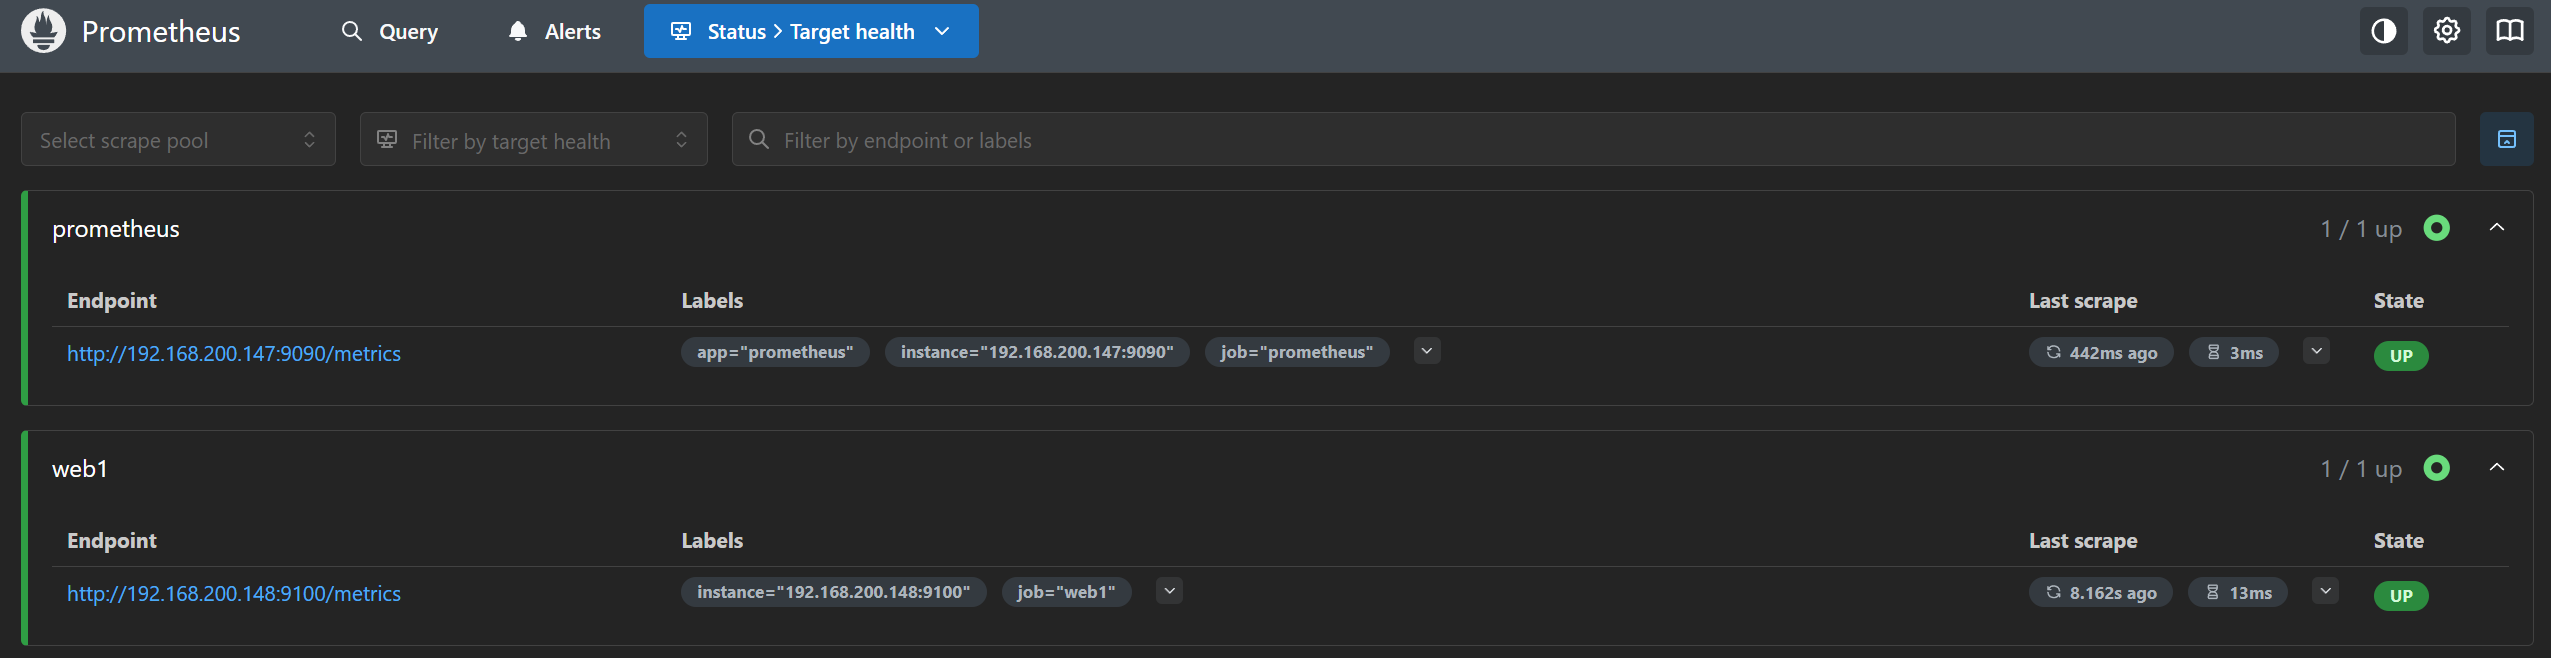
访问http://192.168.200.147:9090/targets 点击Status>Target health即可看见Prometheus和Web1
三、Grafana环境搭建及Prometheus监控指标展示
1、下载Grafana
1 | wget https://dl.grafana.com/enterprise/release/grafana-enterprise-11.1.4.linux-amd64.tar.gz |
默认用户名密码都是admin
2、配置Prometheus数据源
Add new connection—Prometheus
Prometheus server URL:http://192.168.200.147:9090——保存配置(默认记得导入模板)
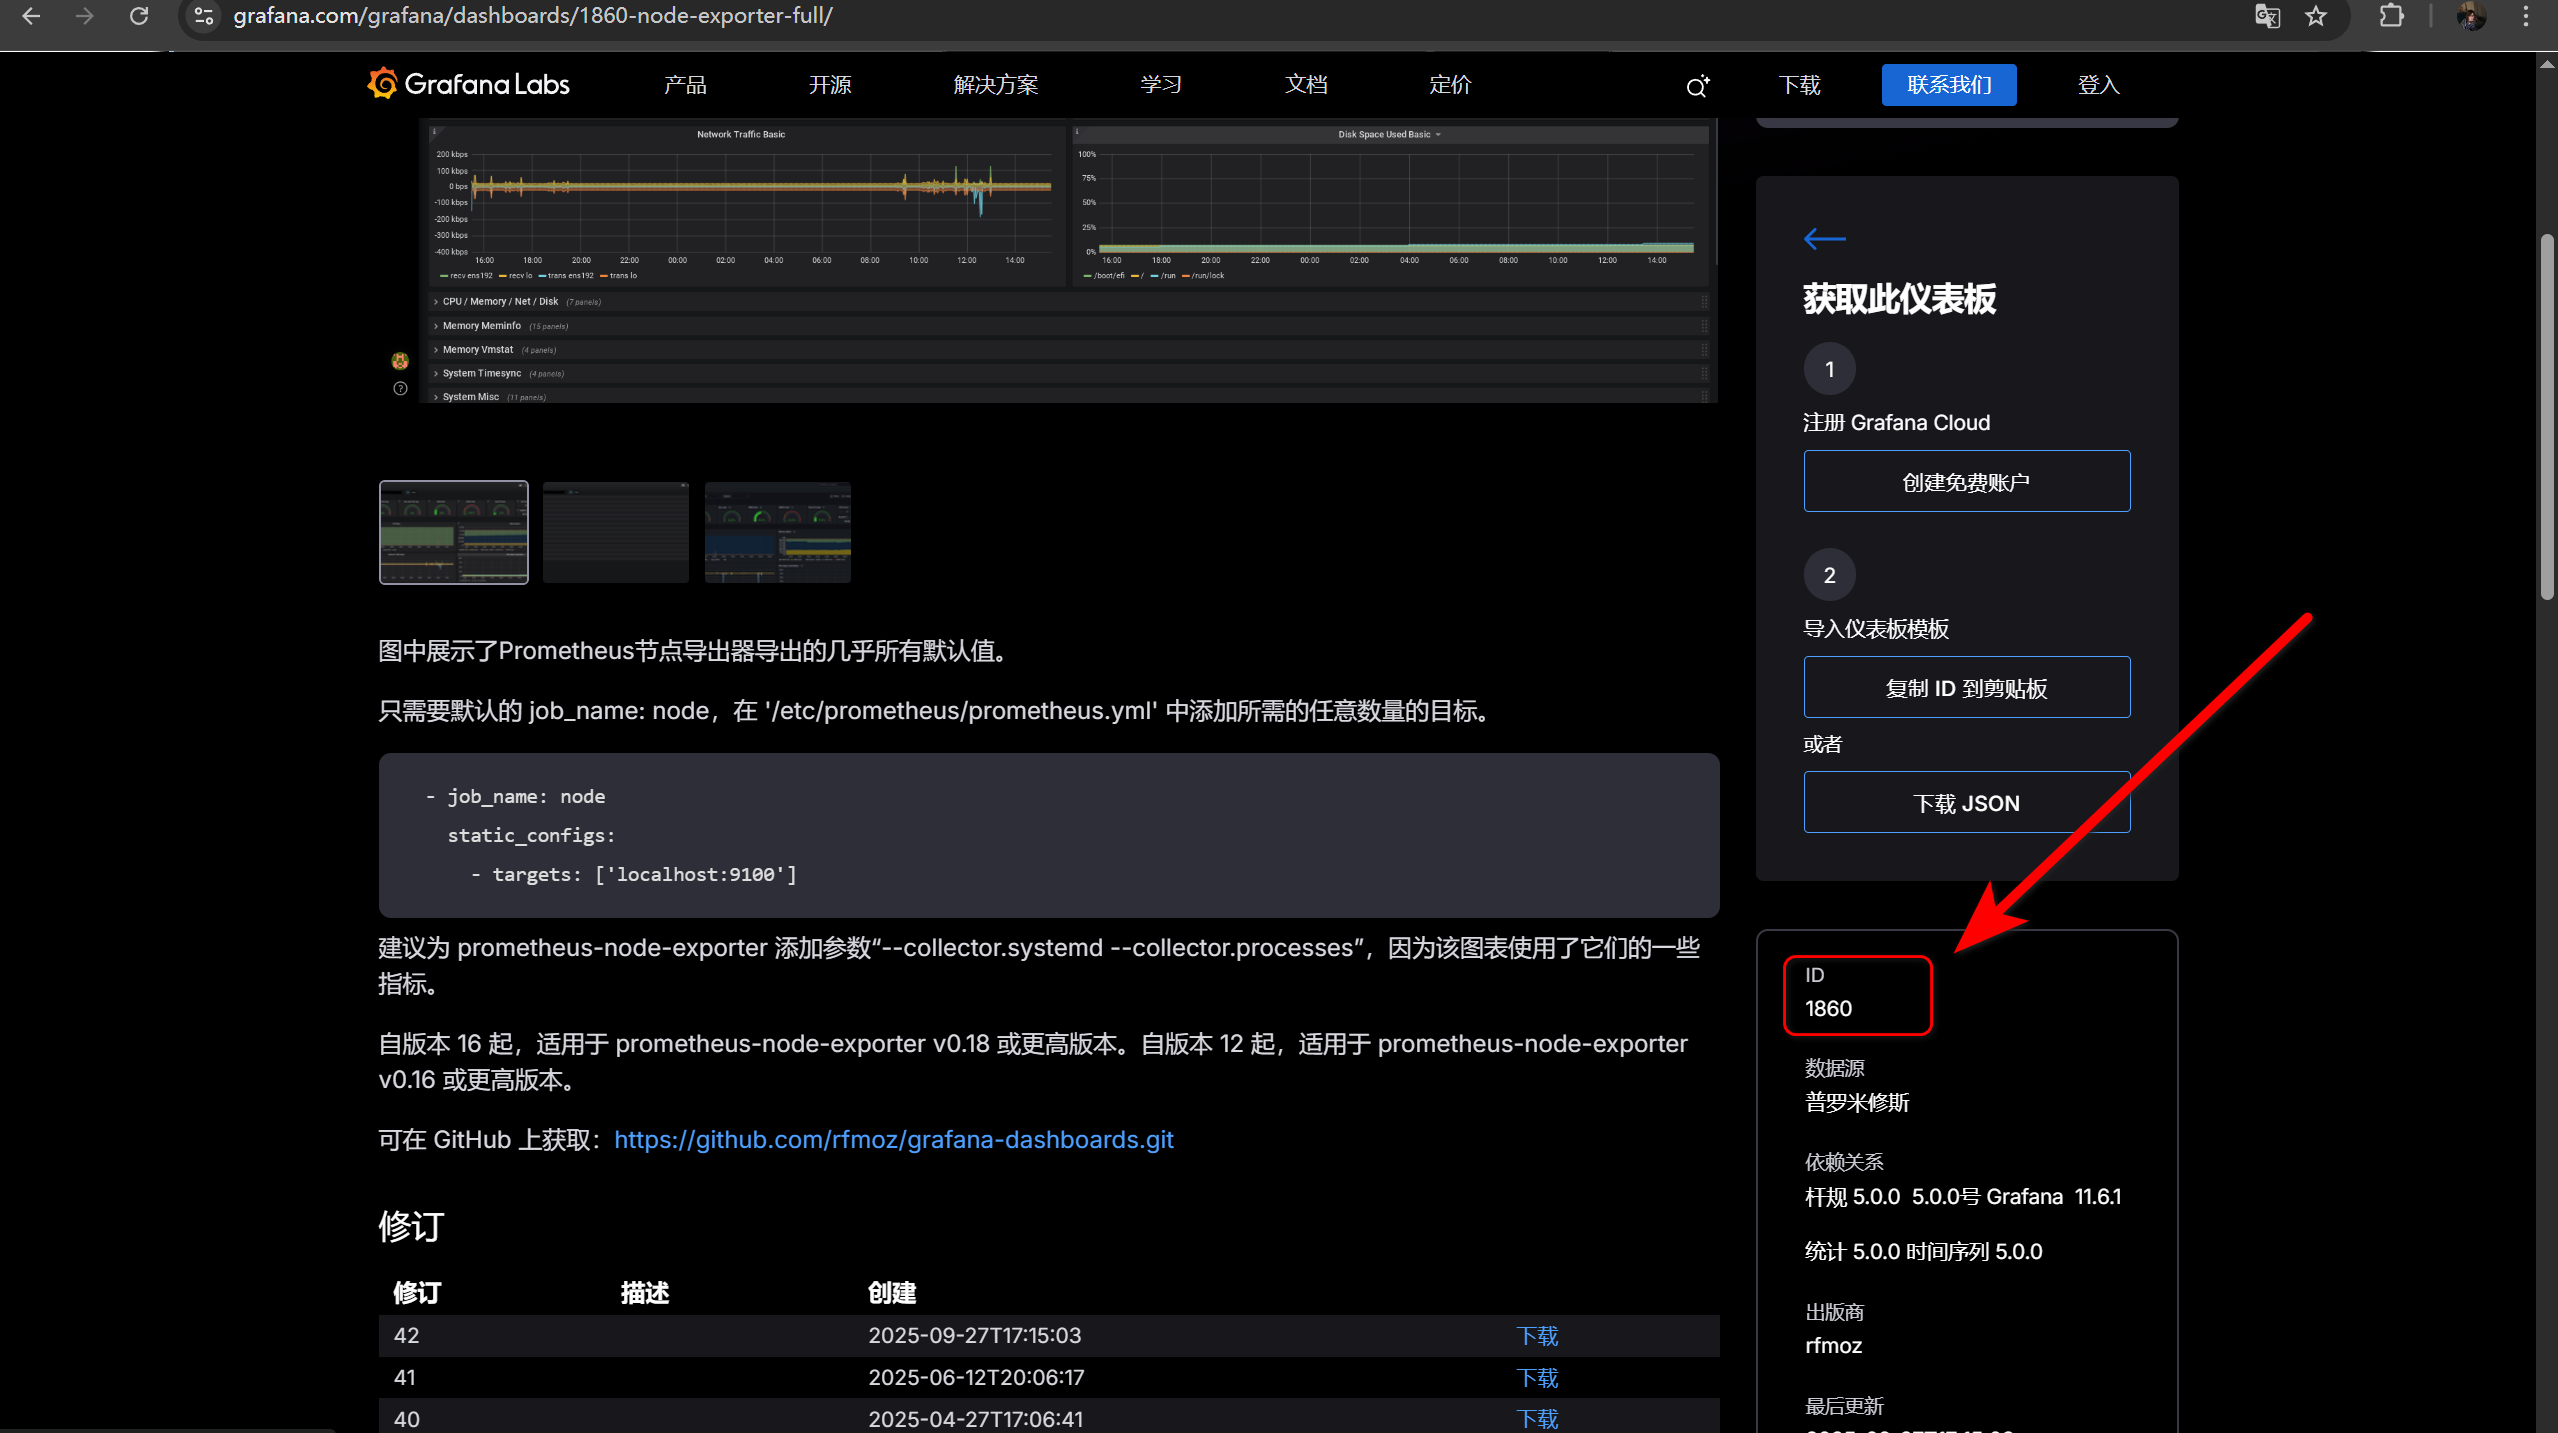
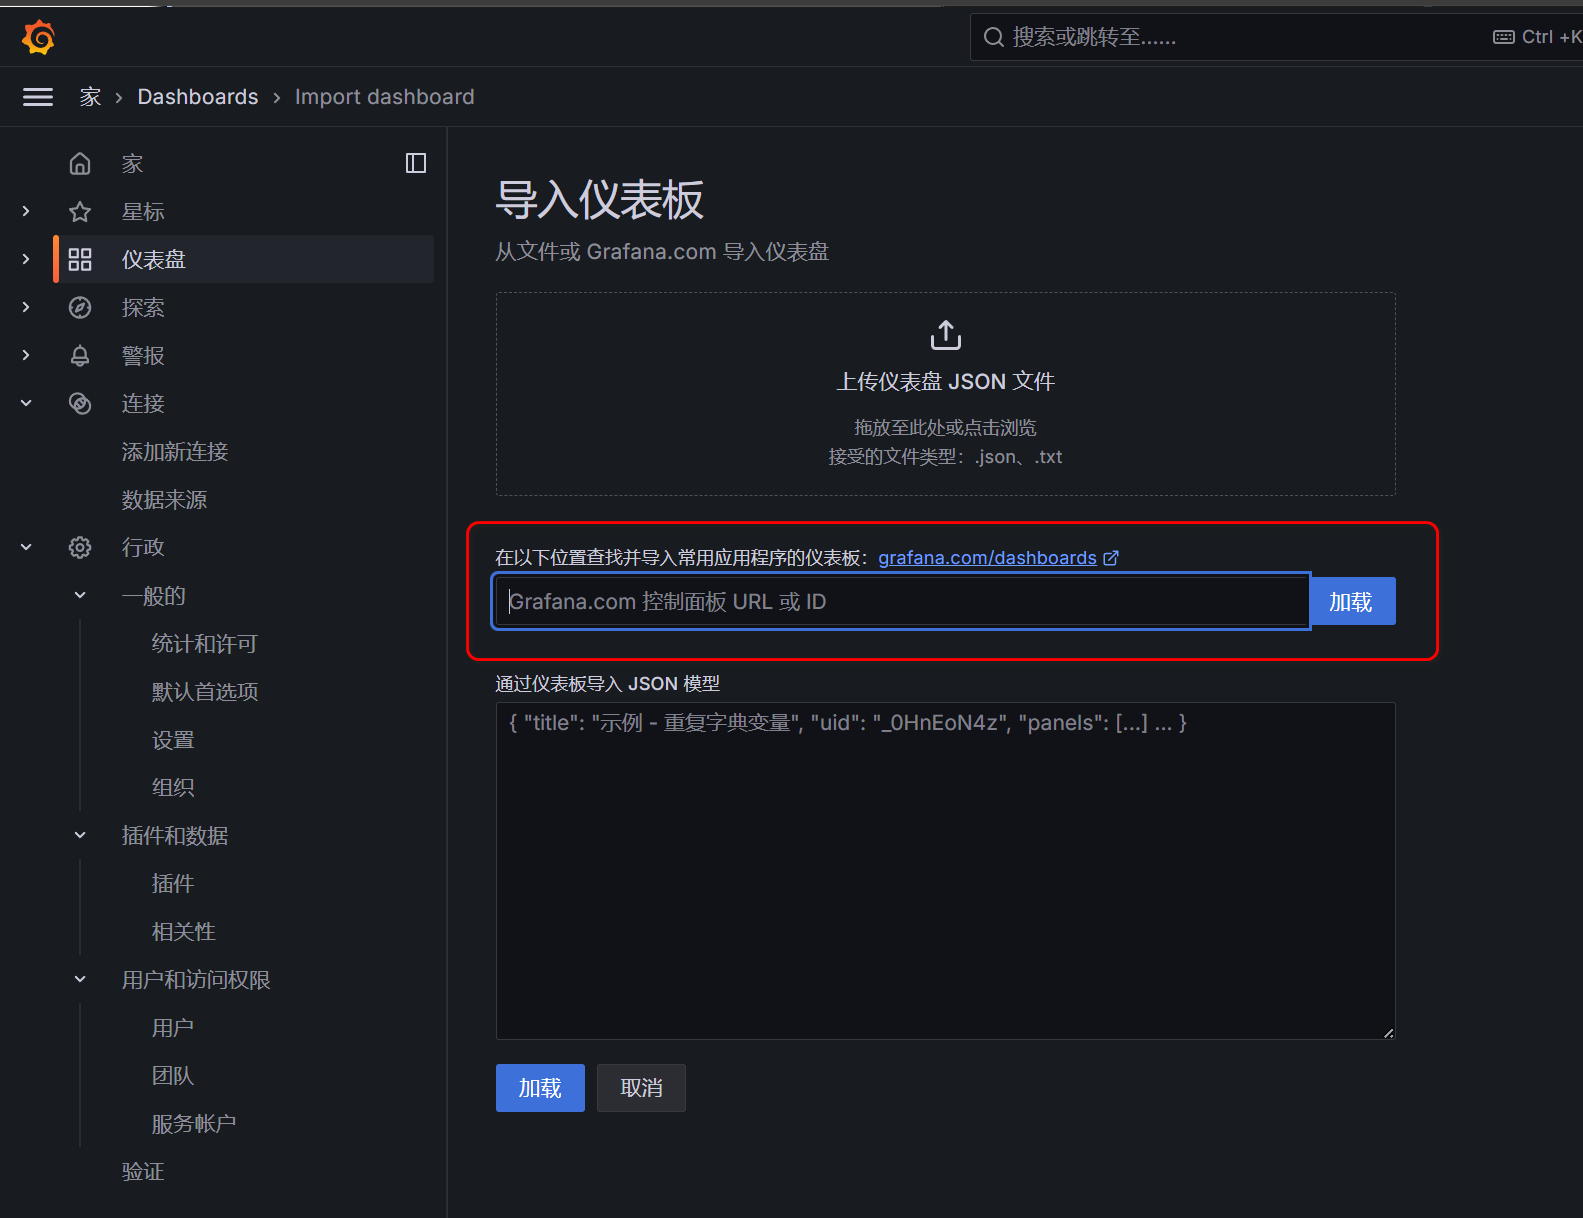
或者访问https://grafana.com/grafana/dashboards/ 然后挑一个点进去,滑下去右下角有一个ID
再填进去
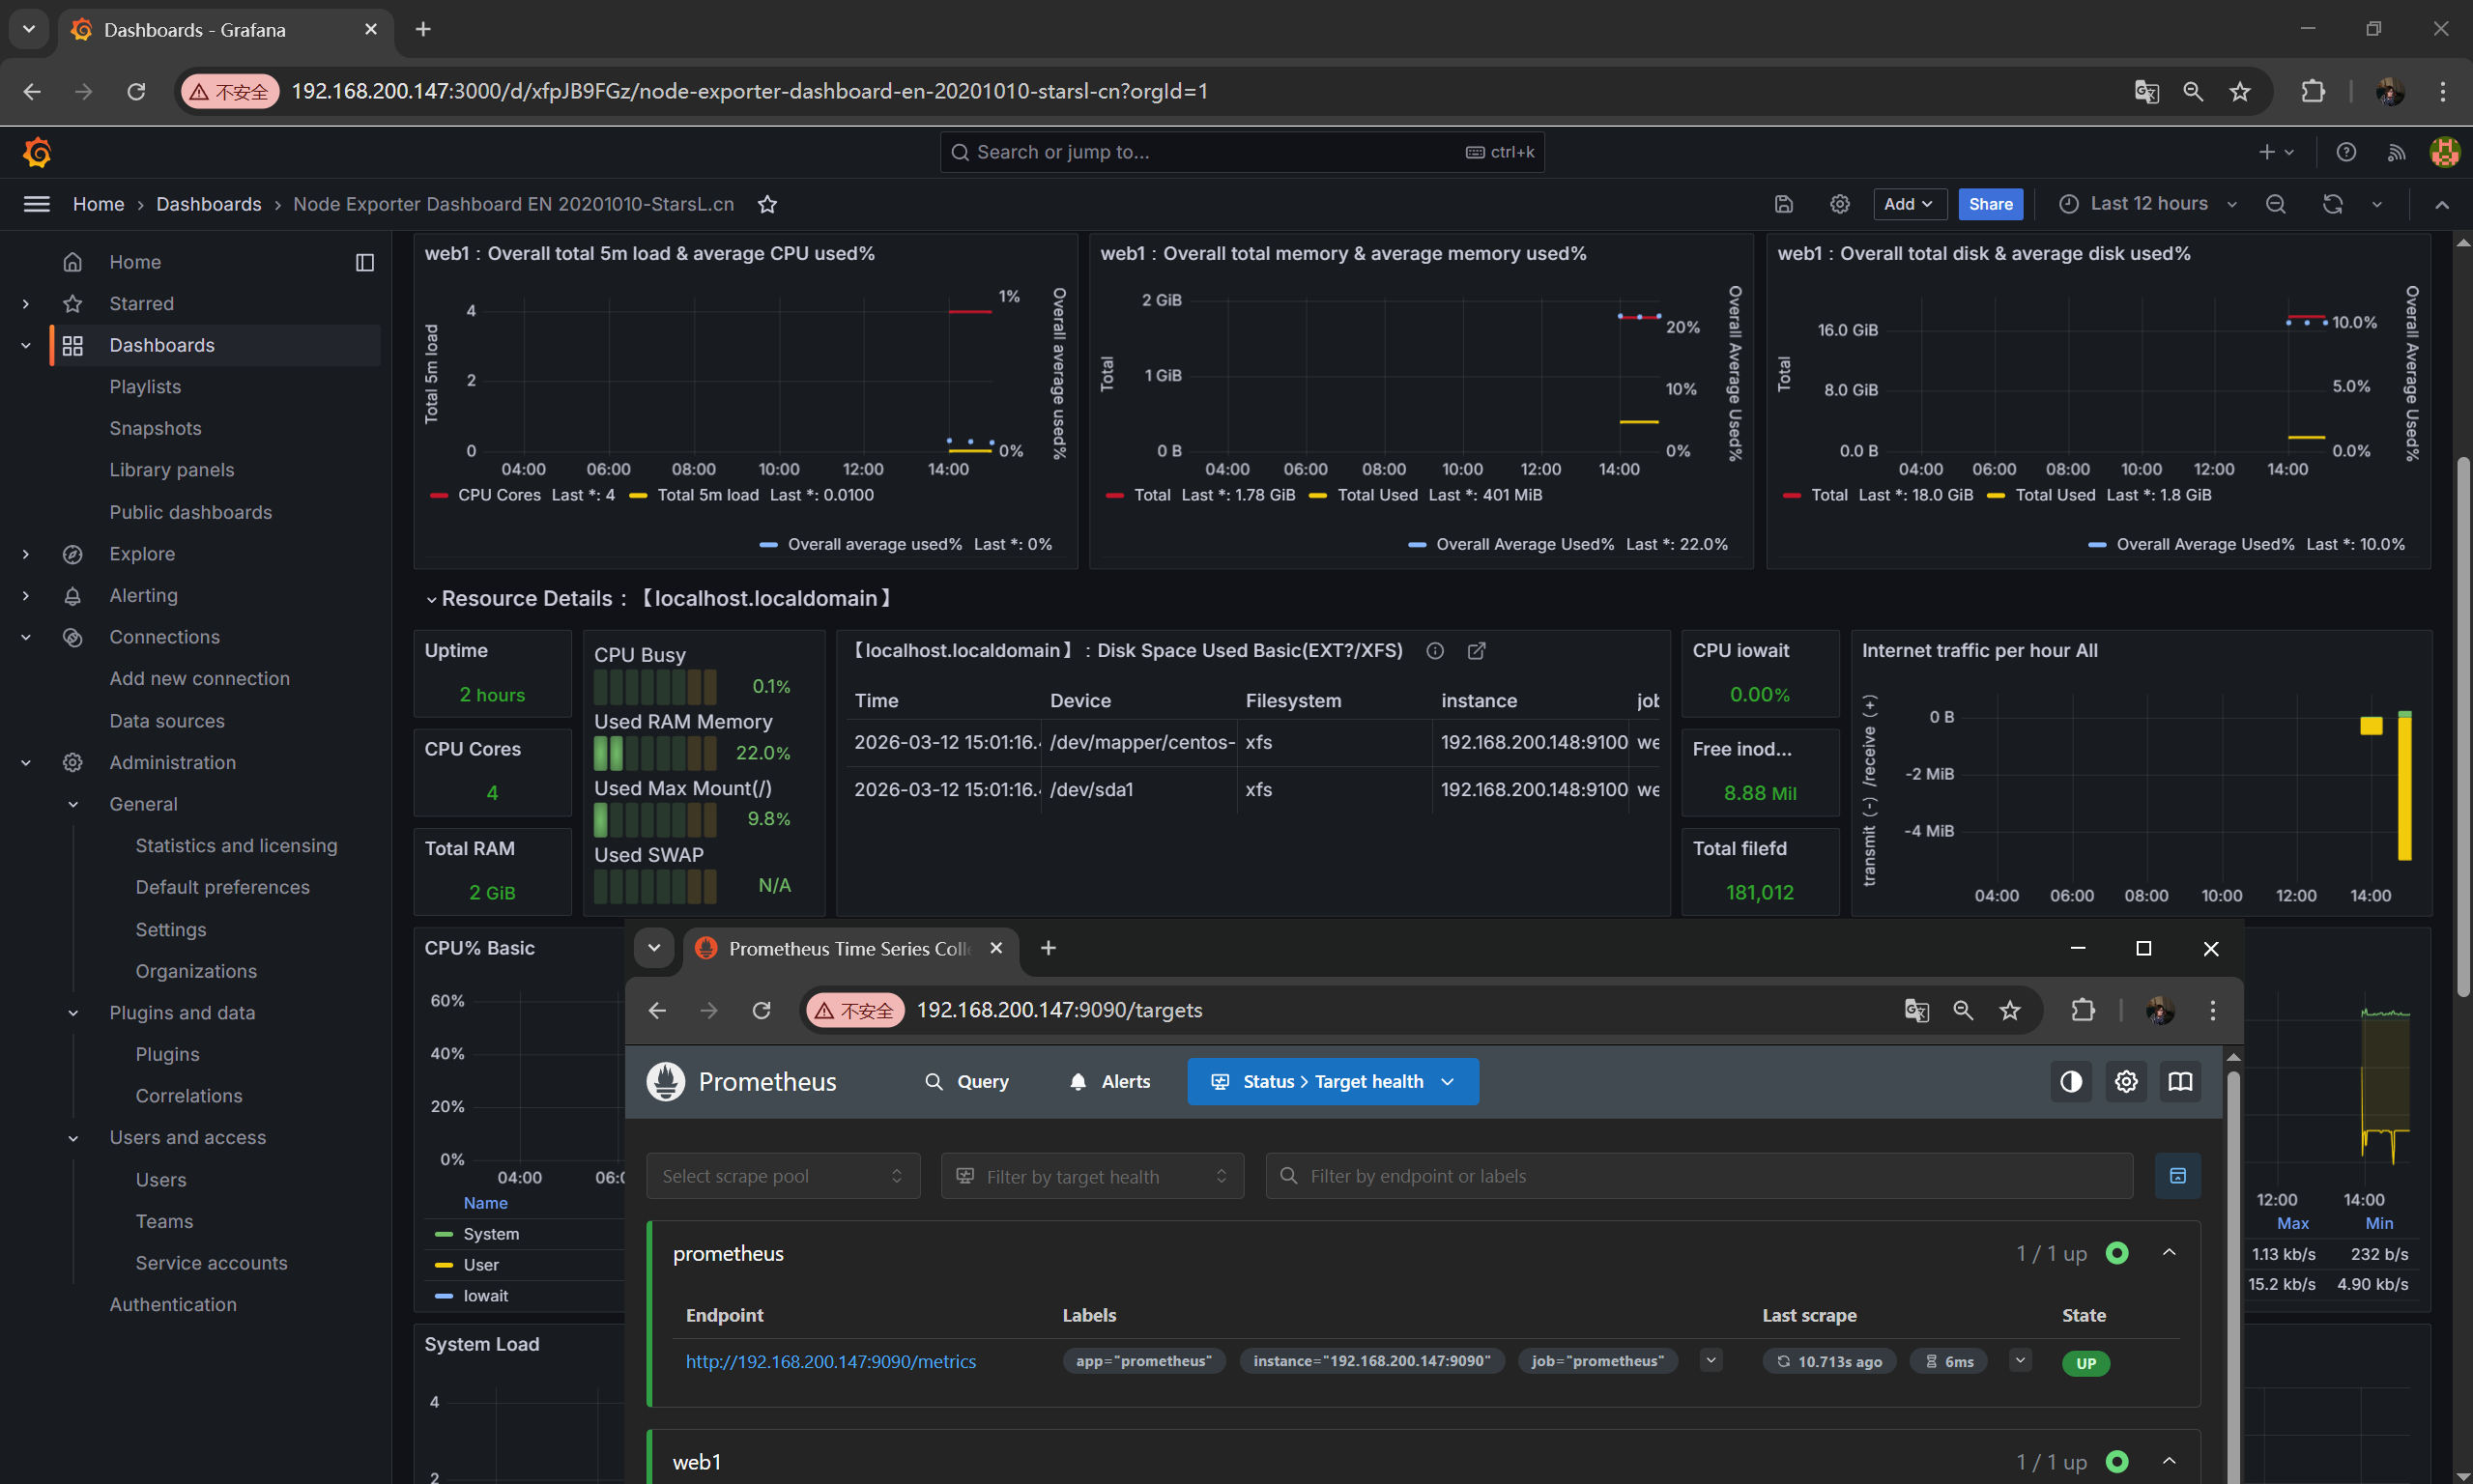
成果展示
喜欢这篇文章的人也看了